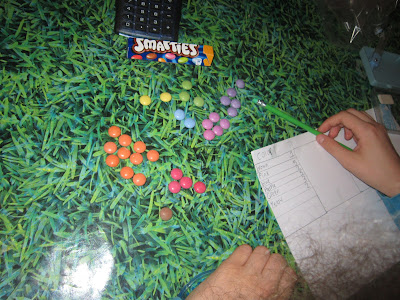
From Christmas to Bodmas- it was hard starting work with the girls again after a lovely Christmas break. Imogen carried on with Bodmas, a topic I could remember from my school days. When I finally got my thinking head on, we started data handling. Firstly, we looked in the newspapers to see how data is displayed.
line graphs
tables
pie charts
We then did data handling activities on:
First they made a table.
Then they converted data into sectors for the Pi chart.
Then measured out the sectors of the pie chart.
The finished pie charts.
You could extend this activity, by asking the children to write questions about the interpretation of their pie charts.


Im your newest follower from the blog hop :)
ReplyDeleteWould love for you to follow me back
Http://www.curvyguruceri.com/